


We are building a new type of learning platform to easily create, collaborate, and share open-source learning resources. Think of it like GitHub + Khan Academy. I will be sharing my journey and progress, through this blog and (maybe) on Twitter using #buildinpublic. Hoping to get the very basic version ready within a month.
You can check out all the posts in this series here.
Day #1: 26th Oct, 2020
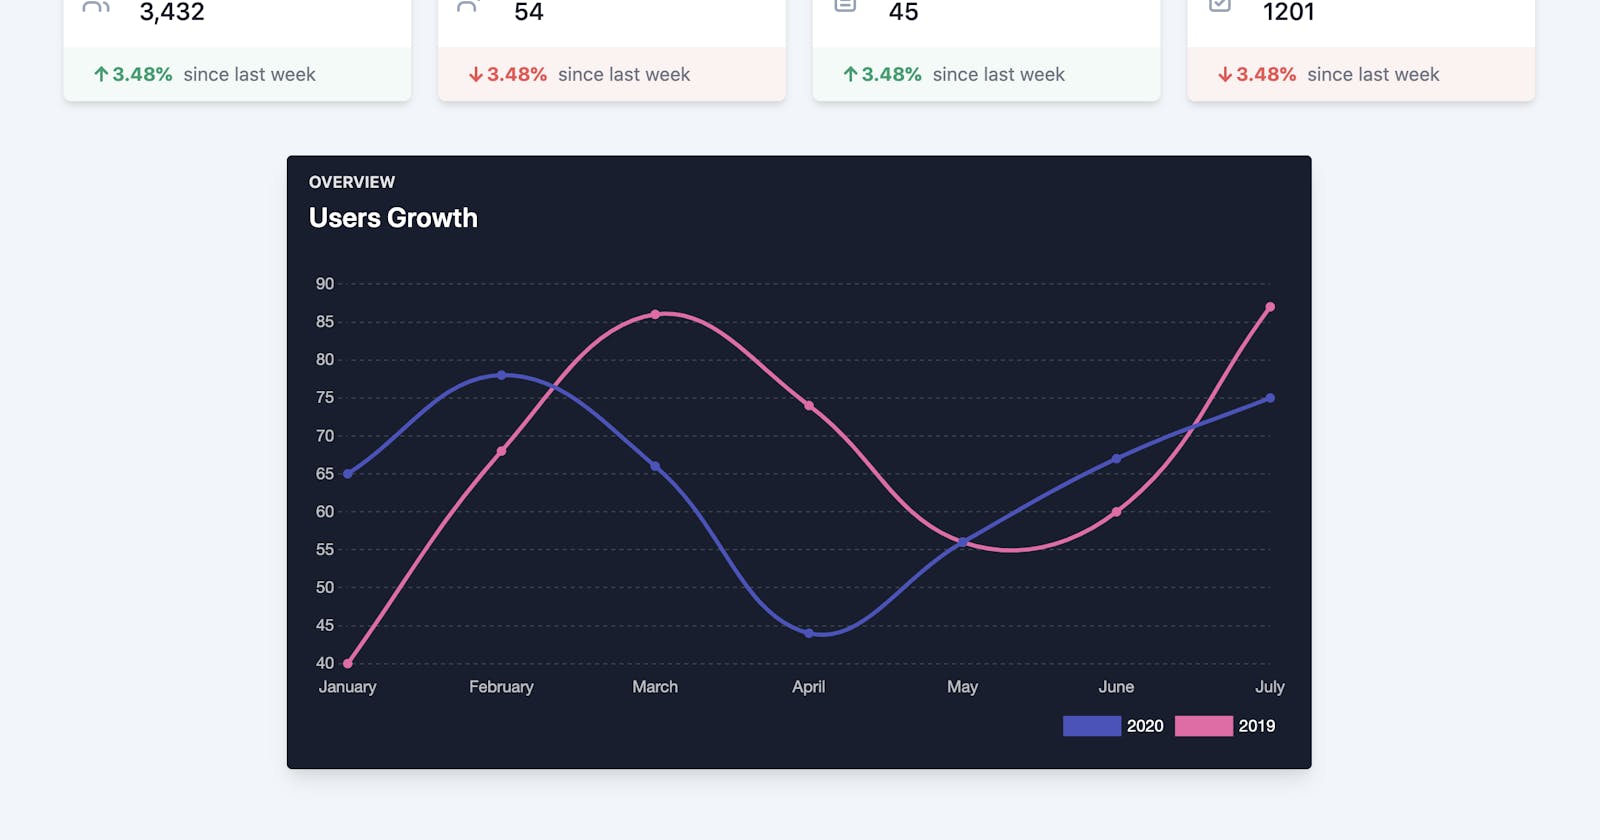
Yesterday, I started working on building a dashboard which should show the overview of various metrics that we want to keep track of.
These are the metrics that we are gonna be keeping track of to measure if the users are getting some value out of the platform.
- No. of signed up users
- No. of active users
- No. of open-source resources being created
- No. of page completions
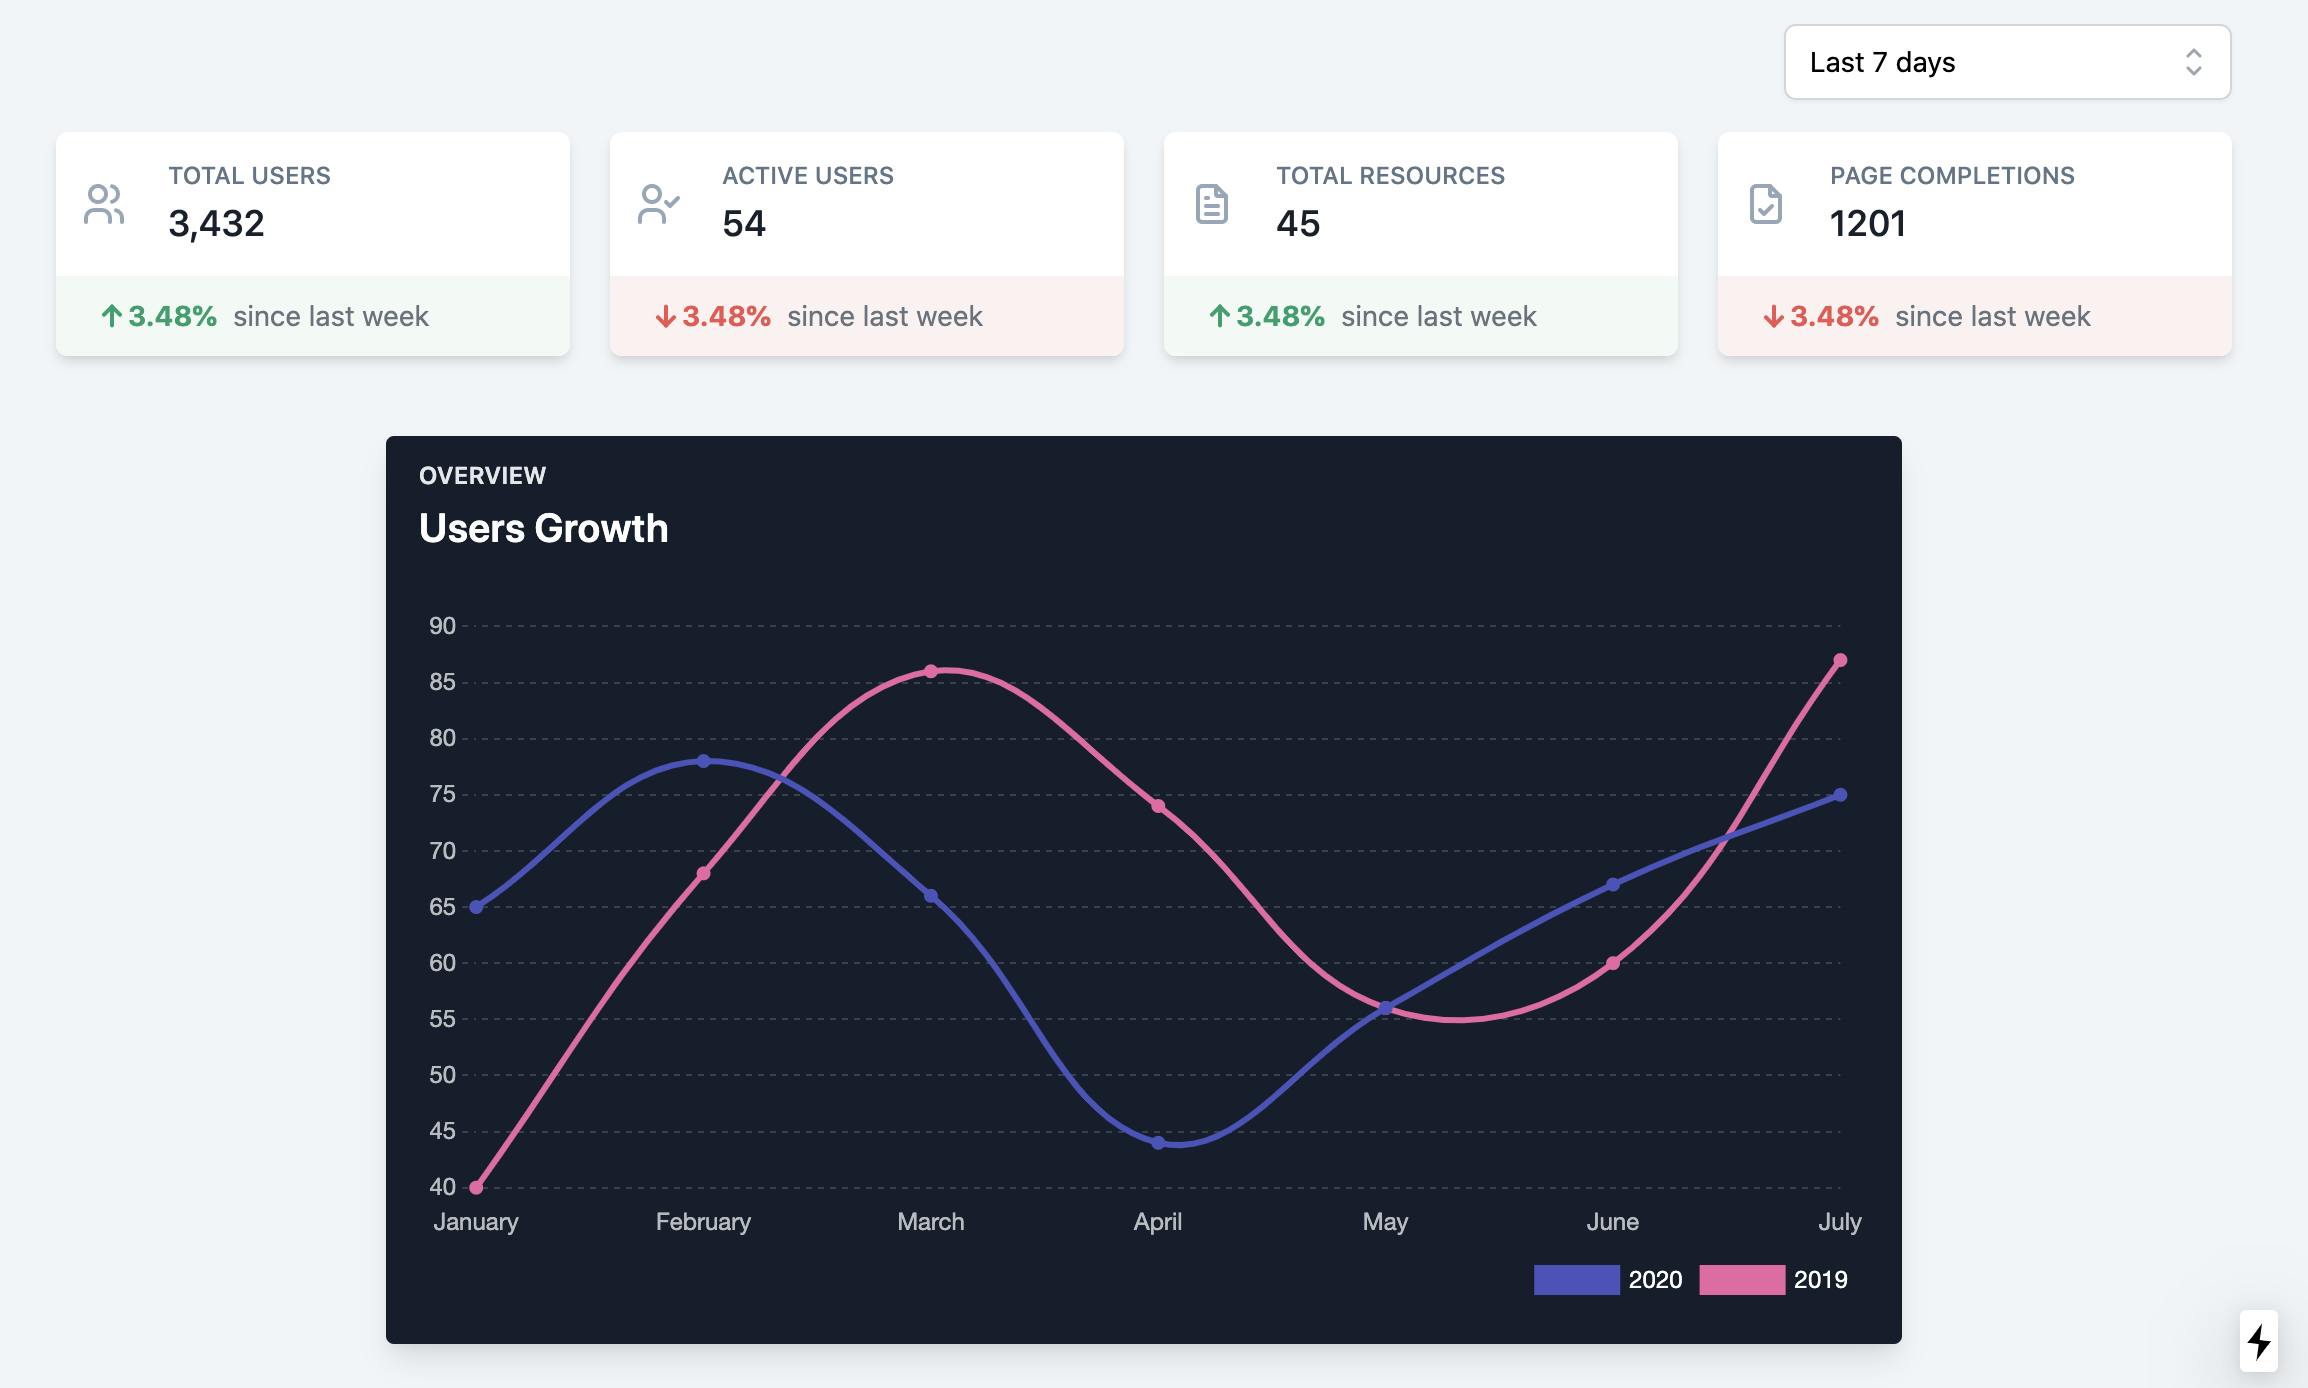
We will be tracking these metrics over a day, week, month, and a year. The screenshot that you see above just shows the dummy data. The graph is meant to show the comparison of the selected metric between the current period vs the previous period. Right now, the graph is not yet linked with the data that is above that.
More about the metrics that we chose:
1. Signed Up Users
Anyone who wants to access and go through the open-source learning resources on the platform is free to do so without any kind of restrictions. Users don't even have to sign up on the platform to do this. We only ask the user to sign up when they want to keep track of the progress that they made in their learning (or) if they want to create a learning resource themselves (or) if they want to edit/contribute to the already existing open-source learning resource. So, tracking the number of signed up users seems like a good metric to keep track of.
2. Active Users
The number of active users is another metric that determines the value. Having a lot of signups but very few active users is a negative sign. The more the number of active users, the more value that the users are gonna get through the platform. Because of this, this would be another good metric to keep track of.
3. Resources Created
For a platform like this to provide value to the users, having quality content on the platform is necessary. Initially, we decided to generate the content ourselves and keep our focus on improving the learners' experience on the platform. But at the end of the day, the number of resources that are being created will be related to the value and engagement that the platform provides. Hence, we decided to keep track of this too.
Another thing that came to our discussion is how to keep track of the quality of resources that will be created on the platform. There isn't a straight forward answer to this question yet. This is yet to be explored.
4. Page Completions
Every resource comprises one or more pages. Users will have an option to keep track of the progress that they made while learning through a resource by marking a page as complete. This metric essentially is keeping track of these page completions.
Another important point that came in our discussion is how to determine a page completion. The most straightforward way is to check if the user clicked on the "Complete" button or not. But there are other things that can also indirectly reference a page completion. Amount of time spent on a page, how much part of the page did the user read, etc. Often times, people don't open a resource with the intention of going through it from end to end. They just want to know how to do a certain thing or they just want to go through a particular section of a page or a resource. So, there needs to be a way to capture this too.
Versioning
Since the resources that are on the platform are open source, we can expect them to change very frequently. So, if the user marks a page as "Complete", but that page is changed since then, Should we still show that page as completed to the user? So, if there is no versioning of the resource, it is difficult to keep track of completion. If we have versioning in place, we can tell the user that they are viewing the older version of the resources, and it has changed some X number of times since then and ask the user itself whether to show the new version or keep the older version.
Doing Experiments
We will be doing a lot of experiments in the process of building this platform. We will be showing those experiments, their start times, end times, etc on the dashboard. The plan is to determine whether an experiment yielded a positive or negative result based on the change in the metrics during the time period of an experiment.
Superhuman Product Market Fit Strategy
A few days ago, we came across a very interesting article on the product-market fit strategy that the company Superhuman used. We decided to adopt the same for our product.
This is the article that describes it.
Basically, it boils down to the following:
Ask your users how they’d feel if they could no longer use your product. The group that answers ‘very disappointed’ will unlock product/market fit.
Companies that struggled to find growth almost always had less than 40% of users respond “very disappointed,” whereas companies with strong traction almost always exceeded that threshold.
They adopted this strategy from Sean Ellis.
These are the four questions that they asked their users who used the product at least twice.
How would you feel if you could no longer use Superhuman? A) Very disappointed B) Somewhat disappointed C) Not disappointed
What type of people do you think would most benefit from Superhuman?
What is the main benefit you receive from Superhuman?
How can we improve Superhuman for you?
I definitely recommend going through the entire article. It's very interesting.
We decided to adopt the same strategy for our platform. These are some of the other quotes from that blog post.
It’s a commonly held view that tailoring the product too narrowly to a smaller target market means that growth will hit a ceiling — but I don’t think that’s the case.
Politely disregard those who would not be disappointed without your product. They are so far from loving you that they are essentially a lost cause.
To increase your product/market fit score, spend half your time doubling down on what users already love and the other half on addressing what’s holding others back.
More on this and how we were planning to adopt this to our platform, will be in the future articles.
Today, I will continue working on the data dashboard and hopefully, make more progress than I did yesterday. The initial goal is to complete work on this by this weekend.
If you have any suggestions or feedback for us, please leave them in the comments.
Technologies Being Used:
- Next.js
- Tailwind CSS, Tailwind UI, Tailwind Starter Kit
- Chart.js
- I have created a Next.js + Typescript + Tailwind CSS + Tailwind UI + React Query + ESlint + Prettier boilerplate for myself so that it will be easy to set up any new projects. I intend to keep it up to date with the latest versions of these. If you are interested, you can clone this repo whenever you want to work on a project with these technologies. It is saving me a lot of time by avoiding the time to set up everything properly for every new project.